
— —
Follow on X
LESSONS

What happened in 1971

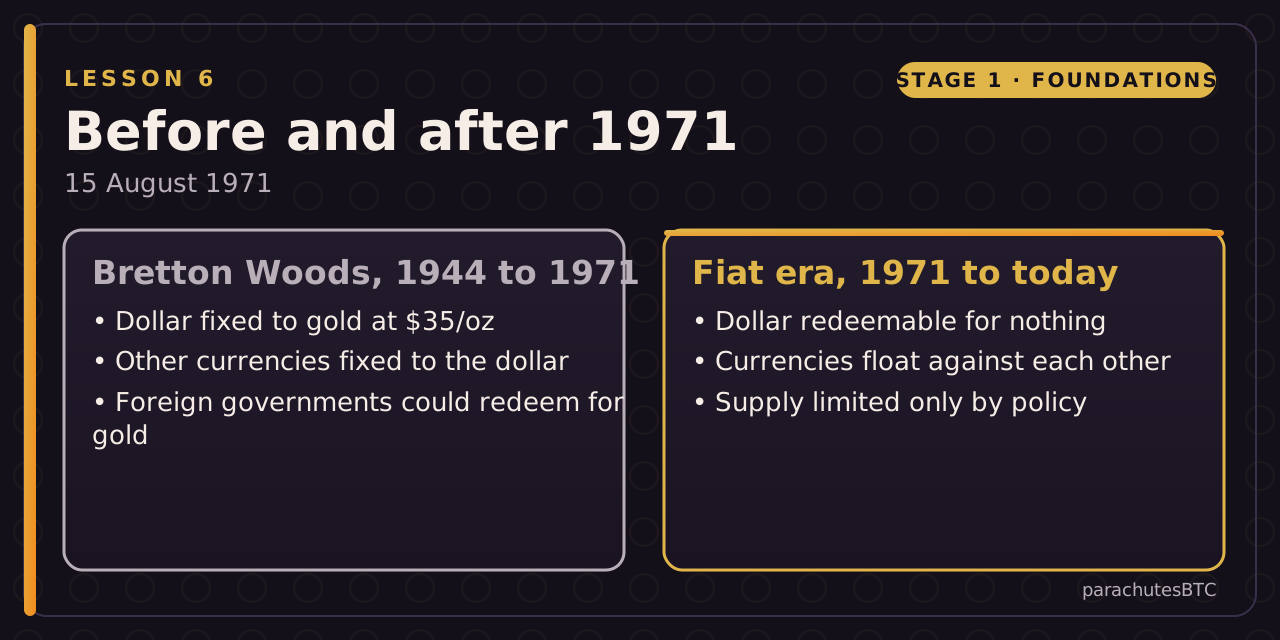
On 15 August 1971 the US ended the dollar's convertibility to gold. Since then every major currency floats, backed by nothing but policy.

6 MIN READ
Two panels comparing the Bretton Woods gold-linked system with the fiat era after 1971.
LEVEL · Beginner
IN THIS LESSON · 6 OF 8
BY THE END YOU WILL BE ABLE TO ANSWER
  • What did Bretton Woods fix the dollar to?
  • Why did the US suspend convertibility in 1971?
  • Which charts bend in the early 1970s, according to the lesson?
  • At $35 an ounce, how many ounces of gold could you get for $700 in 1970?

Then prove it: a 3-question quiz · a challenge. The lesson marks itself complete at 100%.

After this lesson you can: say what changed on 15 August 1971 and why it still matters.

After the Second World War, the Bretton Woods agreement fixed the world's currencies to the US dollar and the dollar to gold at $35 an ounce. Foreign governments could turn dollars into gold on demand. That promise disciplined the printing press.
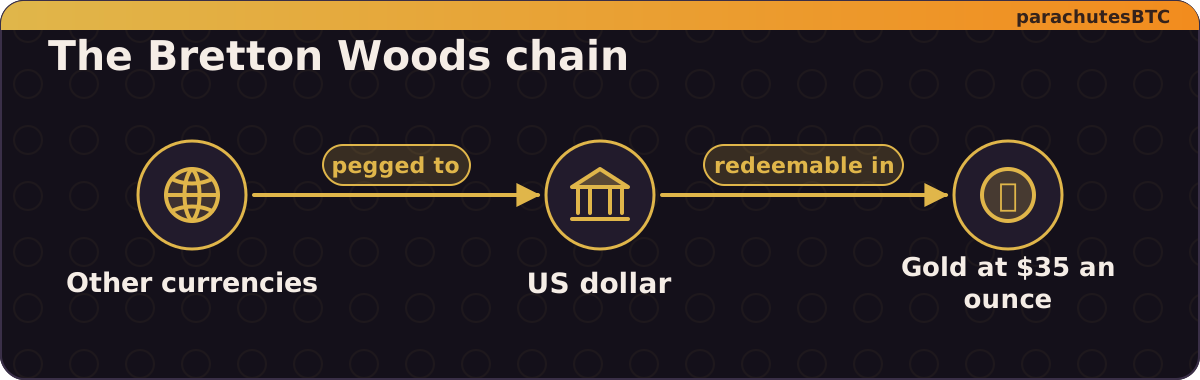
Bretton Woods: world currencies pegged to the dollar, the dollar redeemable in gold at 35 dollars an ounce.
Bretton Woods, 1944 to 1971: currencies pegged to the dollar, the dollar pegged to gold.

Through the 1960s the United States spent on war and welfare and printed to cover it. Gold began leaving the vaults as other countries, led by France, took the US at its word. US gold reserves fell by about half in the 25 years before 1971.
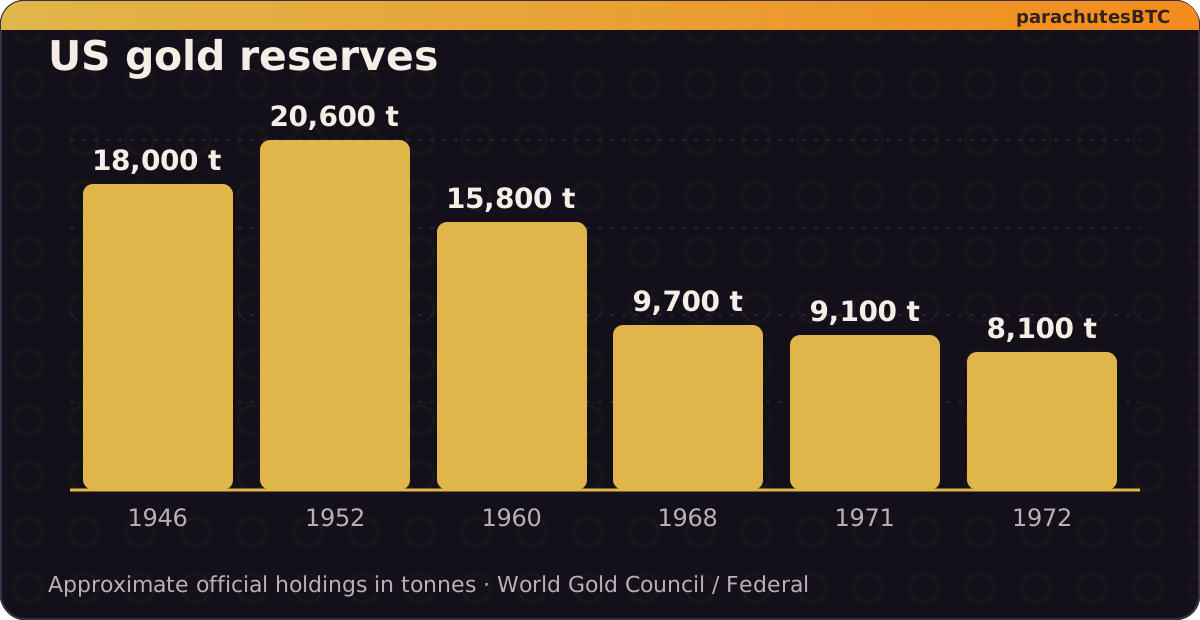
Bar chart of US gold reserves in tonnes falling from about 18,000 after the war to about 8,100 by 1972.
Gold leaving the vaults as foreign governments redeemed dollars. Approximate tonnes.

The Nixon shock

On Sunday 15 August 1971, President Nixon announced on television that the dollar would no longer be convertible to gold. It was called temporary. It never ended. By 1973 the major currencies floated freely, and the fiat era began.

What changed afterwards
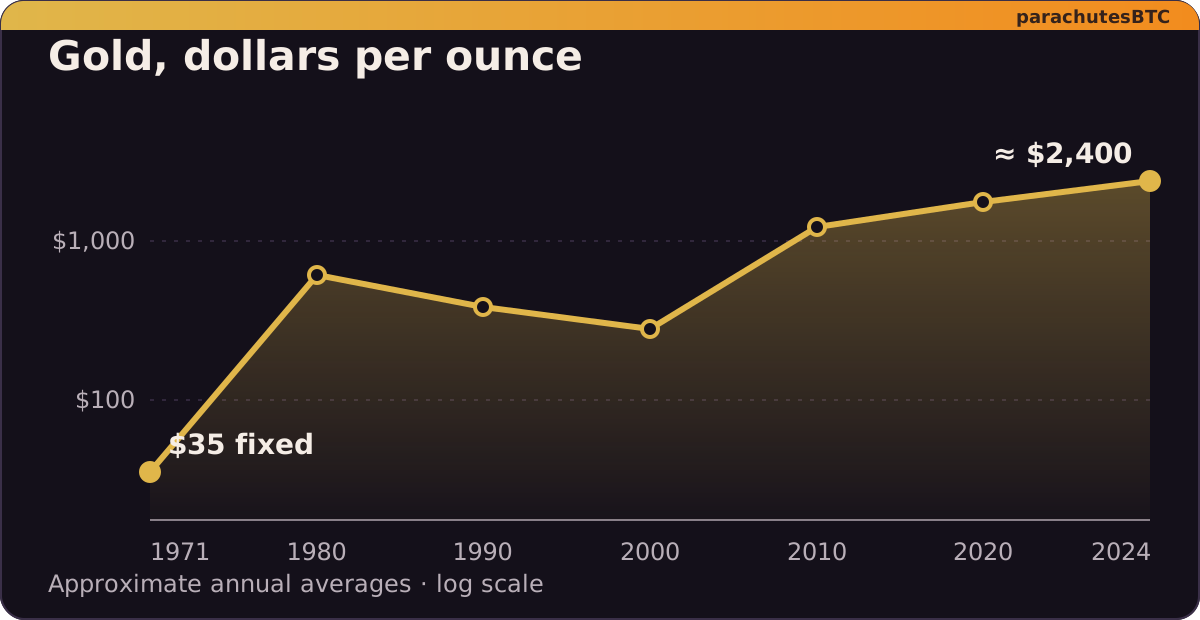
Line chart of the gold price in dollars from 35 in 1971 to roughly 2,400 in 2024, log scale.
Measured in gold, the dollar has been falling since the peg broke. Annual average prices, approximate, log scale.

Line up almost any long-term economic chart and you will see a bend in the early 1970s: productivity and wages, which had risen together, separate; house prices pull away from incomes; federal debt turns upward; the personal savings rate falls; households need two earners where one had been enough. Our Dollar Since 1792 dashboard lets you overlay these series yourself.

WTF Happened In 1971? · Explainer on the charts that bend in 1971Watch on YouTube ↗
$35
an ounce: the gold price the dollar was fixed to until 1971. It has since traded above $4,000.
MINI CHALLENGEGold then and now

At $35 an ounce, how many ounces of gold could you get for $700 in 1970?

ounces
CHECK YOURSELF
1/3 What did Bretton Woods fix the dollar to?
2/3 Why did the US suspend convertibility in 1971?
3/3 Which charts bend in the early 1970s, according to the lesson?
pick an answer for each question

Next

Why do some people save and others spend everything? The quality of money changes behaviour. Lesson 7: time preference.

SOURCES

  1. What happened in 1971? (River Learn)
Progress is saved in this browser only.