
After this lesson you can: describe the cycle pattern and why it may not repeat.
The pattern
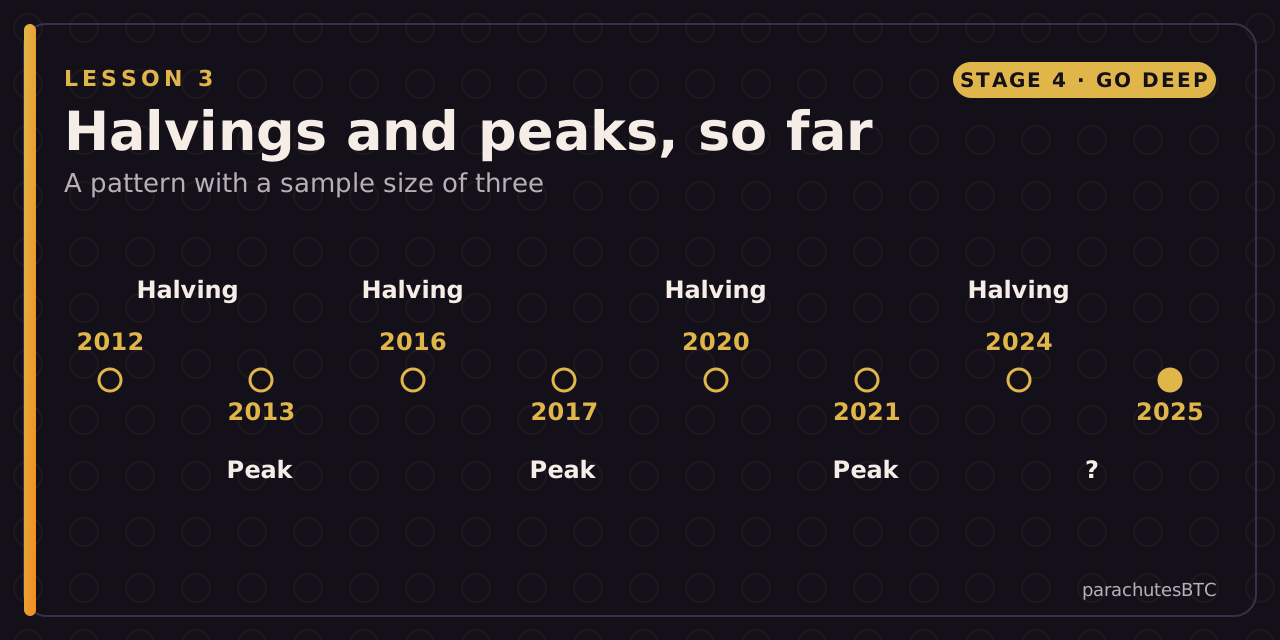
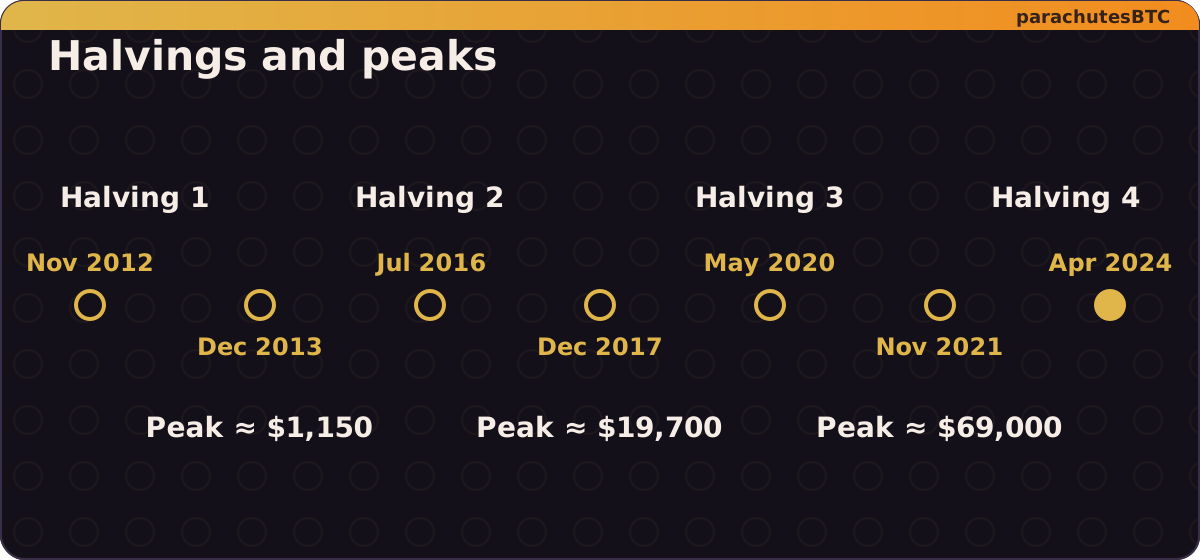
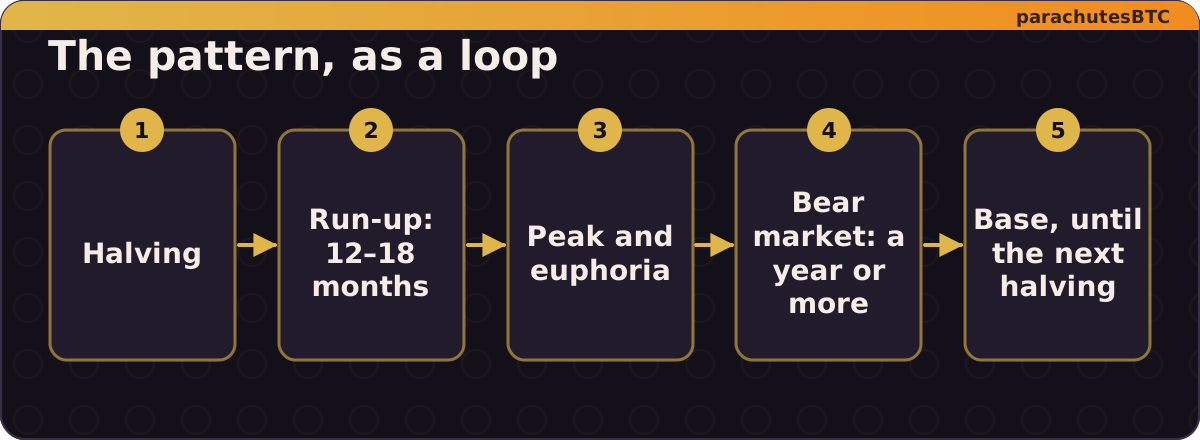
Bitcoin's block subsidy halves every 210,000 blocks, about every four years. After each of the first three halvings, the price rose to a peak roughly 12 to 18 months later, then fell into a long bear market, then based for a year before the next halving. Three cycles, same shape.
The explanations
- Supply shock. Halving cuts new supply in half; if demand holds, price must rise. The effect is real but small: new issuance is now under 1% of supply a year, and markets can see halvings coming years ahead.
- Reflexivity. Rising prices attract attention, which attracts buyers, which raises prices, until leverage and euphoria exhaust the buyers.
- Global liquidity. Bitcoin's peaks and troughs have lined up with loosening and tightening of global money. Some argue the "halving cycle" is mostly the liquidity cycle wearing a costume.
Stock-to-flow
A popular 2019 model tied price to the ratio of existing supply to new supply, which jumps at each halving. It fit history beautifully and then predicted $100,000 by 2021 and much more by 2024. It missed badly. The lesson is general: a model fit to three data points will fit three data points.
How to use this
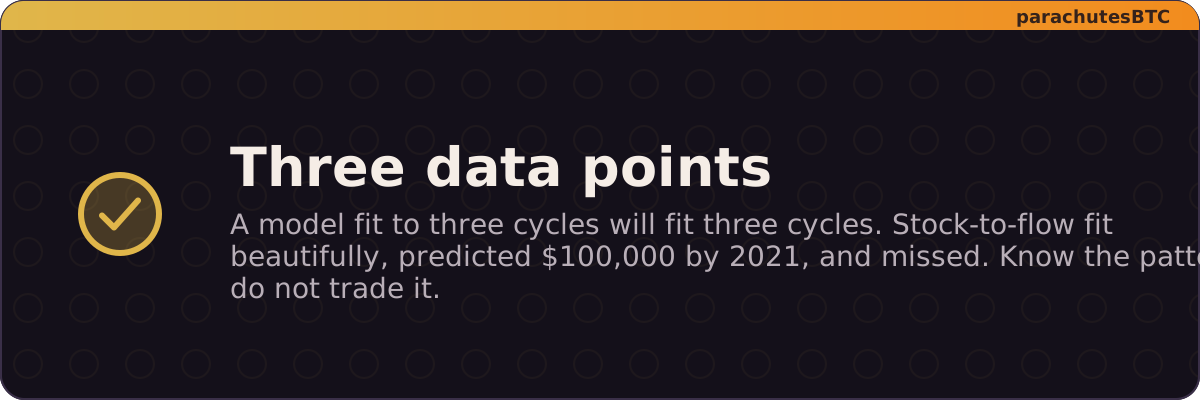
Know the pattern. Do not trade it. If the cycle holds, you will see a drawdown after the peak and a slow base before the next halving; if it breaks (and growing institutional flows may well break it), the people who bet on it will be the ones hurt. The halving countdown tells you where in the schedule we are; nothing tells you where in the cycle.
Peaks followed the 2012, 2016 and 2020 halvings by roughly a year. How many data points is that?