
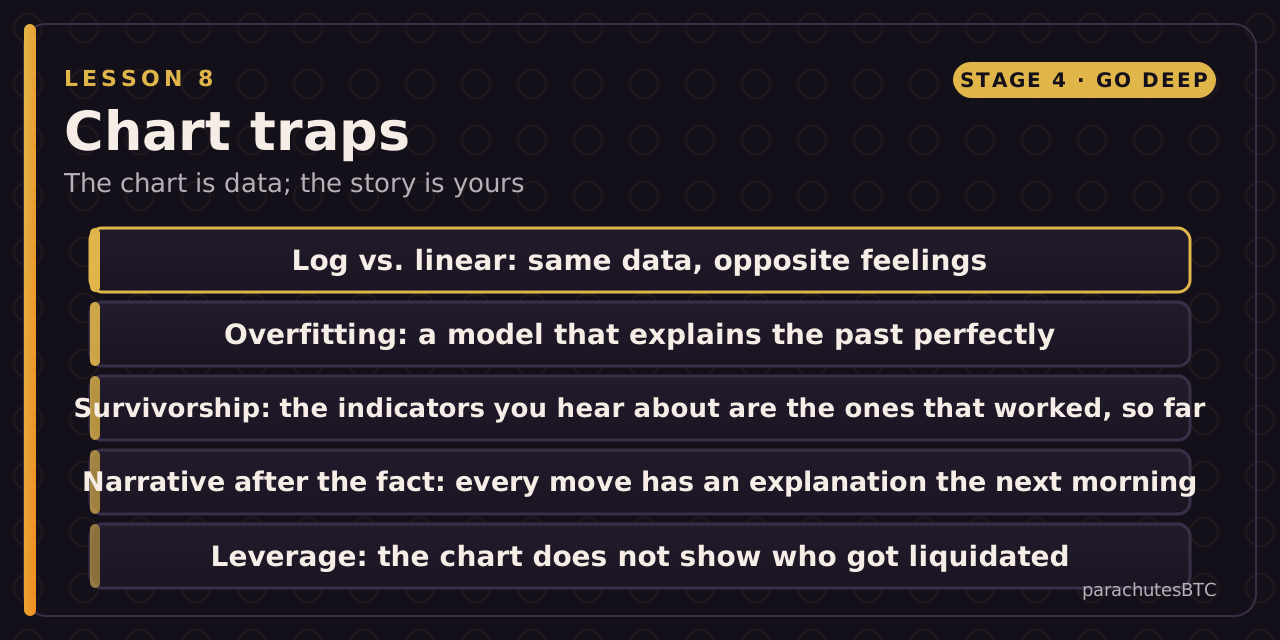
After this lesson you can: spot the four ways charts mislead.
The dashboard gives you dozens of charts and the ability to overlay anything on anything. That is power, and power to mislead yourself. Five traps.
1. Linear versus log
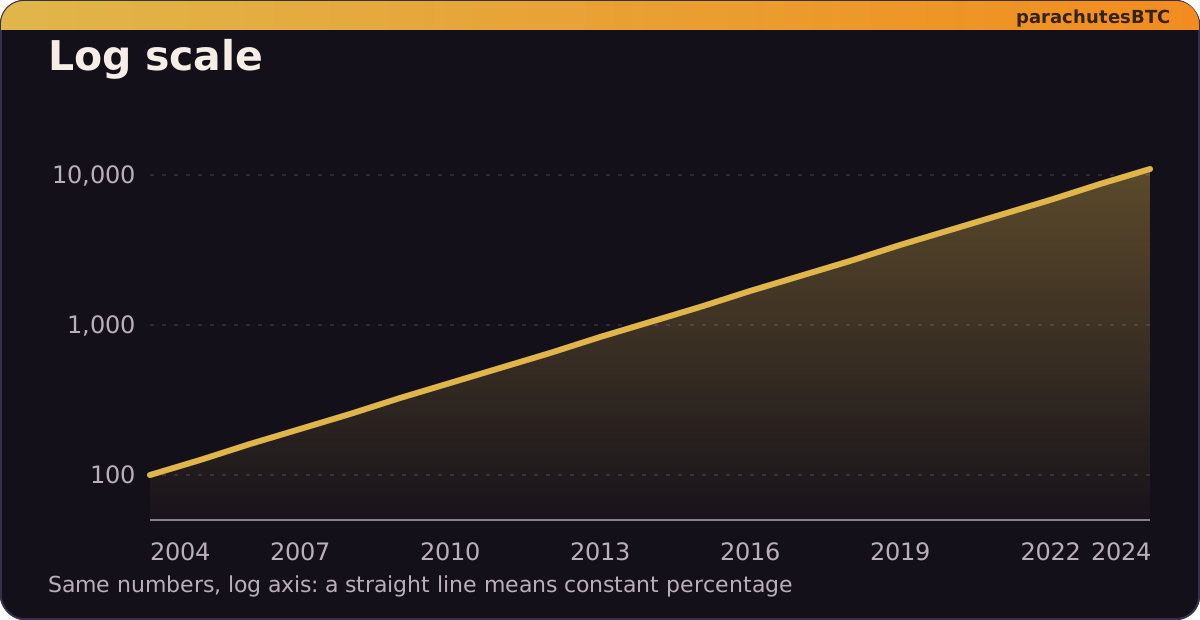
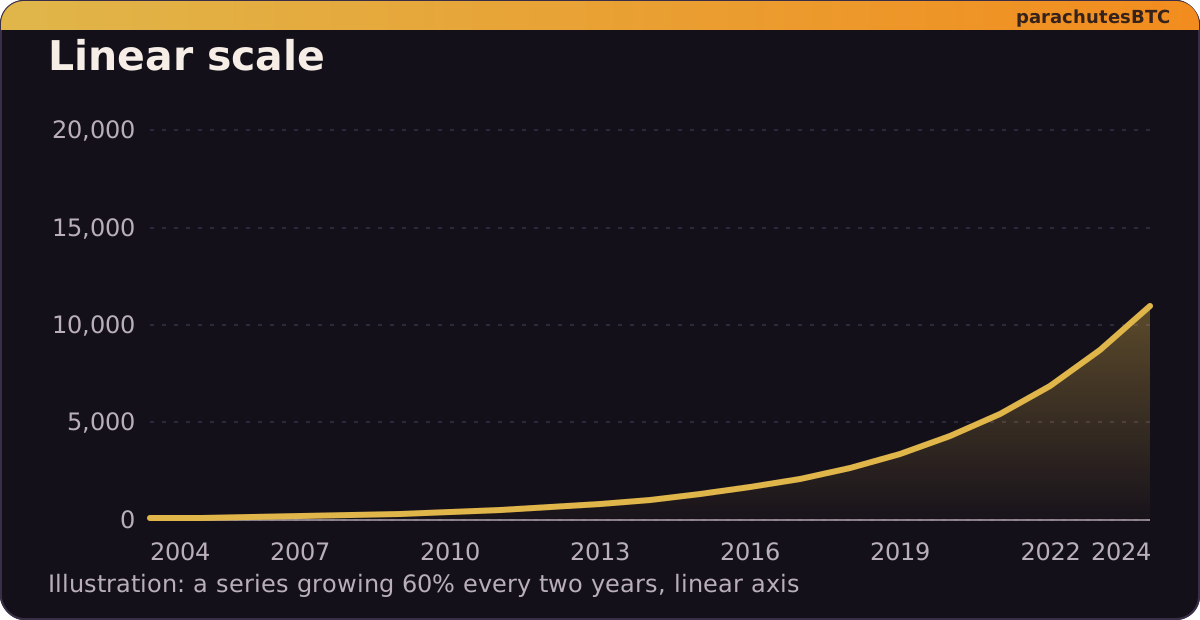
On a linear scale, bitcoin's history looks like a vertical cliff and every past cycle looks flat. On a log scale, each cycle's percentage moves are visible and comparable. Neither is "right"; know which you are looking at and why it feels the way it does. The dashboard lets you toggle.
2. Overfitting
Any curve can be fit to any history with enough parameters. Rainbow charts, power-law corridors and stock-to-flow all fit the past. Fitting is not forecasting. The test of a model is its out-of-sample predictions, and most bitcoin models have failed theirs.
3. Survivorship
You hear about the indicator that called the last bottom. You do not hear about the hundred that did not. Indicators that worked three times are not proven; they are undefeated with a small sample.
4. Narrative after the fact
Every morning, the news explains yesterday's move: "bitcoin fell on ETF outflows", "bitcoin rose on rate-cut hopes". These are written after the price moved and would have been written the other way had it moved the other way.
5. Correlation on the overlay

Overlaying M2 or the S&P on bitcoin will often look convincing. Two things that both go up over time will correlate. The dashboard's overlay tool is for asking questions ("do these move together in this period?"), not for proving causes.
The habit
Use the data to understand what happened and where things stand. Be suspicious of anything that tells you what happens next, including your own instinct after you have looked at a chart for an hour.
Course checklist: what you can now do
Tick each one you have actually done. The course is finished when they are all ticked, not when the quiz is.
On a log chart, a move from $10 to $100 takes the same vertical space as a move from $100 to what?